
Indiana's Hard-to-Count Areas
It's a big state! With more than 6.6 million people living in Indiana and nearly 40,000 square miles of land to cover, efforts to promote the census can be helped by knowing where to target messages. That's where the "Hard-to-Count" (HTC) scores come in.
Publications
Differential Undercounts in the U.S. Census
Who is Missed?
This free, open access book by William P. O'Hare provides an overview of which groups have the highest net undercounts and which groups have the higher undercount differentials in the US census.
Discusses why census undercounts occur.
Combines all the statistical evidence on this topic in one publication.
Planning Database
The Census Bureau makes a planning database available, which compiles a range of housing, demographic, socionomic and census operational data at the block group and tract level, including a new low response score (LRS).
Response Outreach Area Mapper
The Response Outreach Area Mapper (ROAM) application was developed to make it easier to identify hard-to-survey areas and to provide a socioeconomic and demographic characteristic profile of these areas using American Community Survey (ACS) estimates available in the planning database.
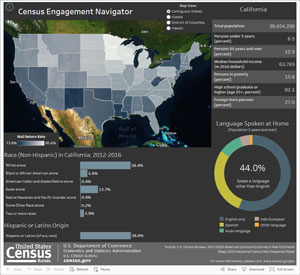
The Census Engagement Navigator
The Census Engagement Navigator for the 2020 Census helps you view communities with high or low return rates for the 2010 Census and current demographic makeup of the same neighborhoods.
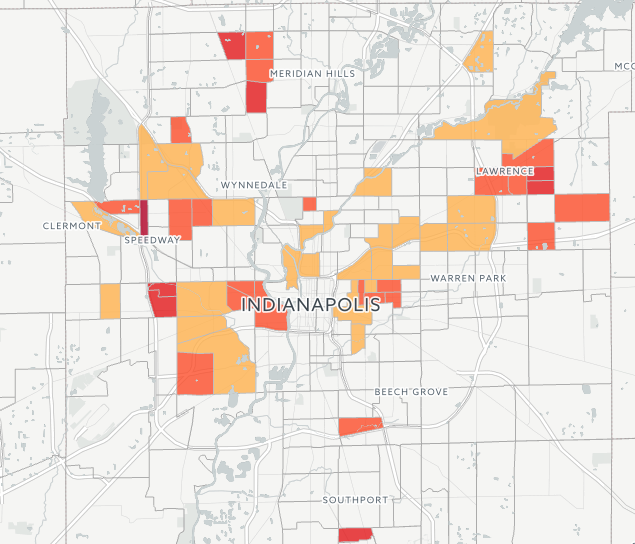
Map of hard-to-count areas
This nationwide interactive map considers a a census tract hard-to-count if its self-response rate in the 2010 decennial census was 73% or less.